


The scene repeats itself in boardrooms: the CMO presents a dashboard full of upward-trending graphs—impressions, clicks, reach, leads generated—and the CFO raises their hand with the uncomfortable question:
And how much actual revenue did all those campaigns generate?
The silence that follows is revealing. Budgets have been analyzed with a magnifying glass, growth goals are increasingly aggressive, and marketing and sales departments in LATAM face an unavoidable reality: demonstrate tangible value or lose strategic relevance.
The uncomfortable truth: your executive committee doesn’t want to see clicks. They want to see real revenue.
What are vanity metrics and why are they no longer enough?
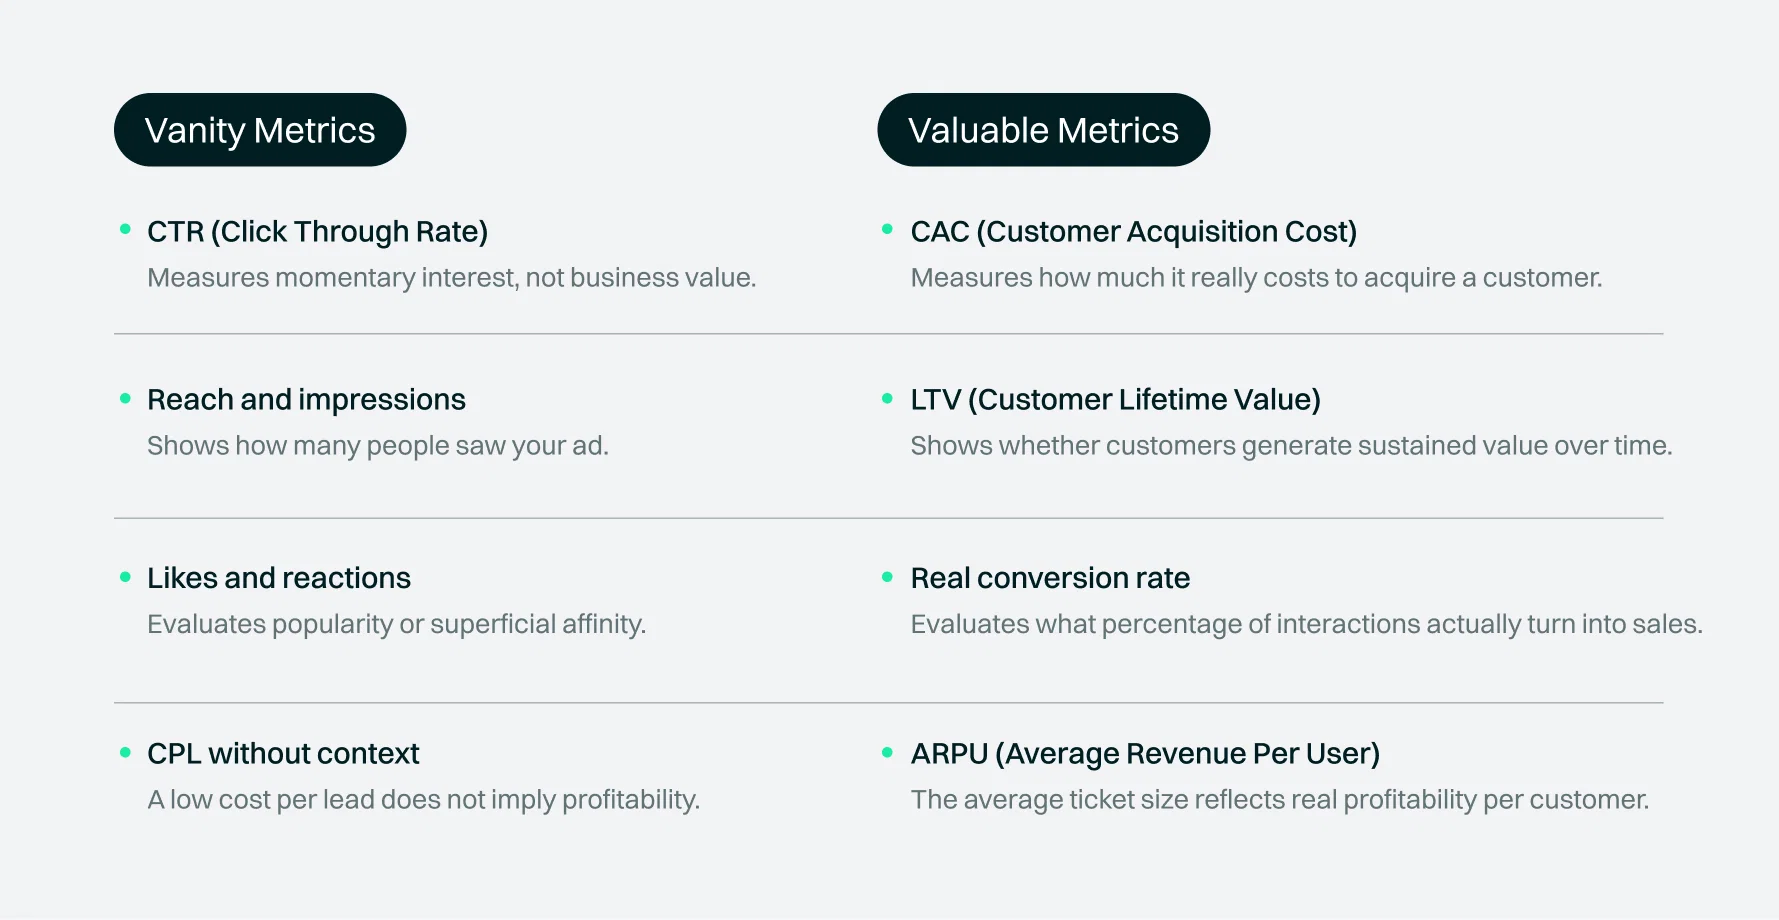
Vanity metrics look good in a presentation, but they do not connect with real results:
- CTR (Click-Through Rate)
- Reach and impressions
- Social media like
- CPL (Cost Per Lead) without conversion context
The problem: they measure activity, not impact.
Example: A $5 CPL seems excellent… until you discover that none of those leads convert into customers. A campaign with 100,000 impressions sounds impressive, but if it doesn’t generate sales, does it really matter?
In the boardroom, activity without commercial results is statistical noise.
The indicators that really matter in the boardroom
To earn a seat in strategic conversations, you need to speak the language of the CEO, CFO, and CSO. That language has a specific grammar: revenue, profitability, and scalability.
1. CAC (Customer Acquisition Cost)
The most democratic metric in the boardroom: everyone understands it, everyone respects it.

Why the CFO demands it:
- If it costs $500 to acquire a customer who generates $300 → business model problem.
- If that customer generates $2,000 → scalable asset.
Your credential for budget approval: A decreasing CAC demonstrates optimization. A controlled CAC while scaling demonstrates sustainability.
2. LTV (Customer Lifetime Value)
If CAC shows what it costs to acquire, LTV reveals how much that customer is worth over time. It transforms the conversation from costs to investment.
Examples by industry:
| Industry | Key Metric | LTV Impact |
| Telcos | 24-month ARPU | Justifies high CAC |
| Insurance | Renewed policies | Year-over-year recurring value |
| Fintech | Product usage | Post-acquisition multiplied revenue |
| Education | Ticket per program | Value across several semesters |
The difference-maker: An LTV:CAC ratio of 3:1 or higher = healthy business.
3. Real Conversion Rate (lead → customer)
Here, many strategies crumble under scrutiny.
The common scenario:
- 100,000 monthly lead
- 8,000 become customers
- Conversion rate: 8%
But the key question is: Are we attracting quality leads that actually convert, or are we optimizing for volume without profitability?
What really matters: Not just the conversion %, but how much each closed deal bills and how much it costs to acquire it. You can have a 15% conversion rate with an unsustainable CAC, or 5% with customers generating high LTV.
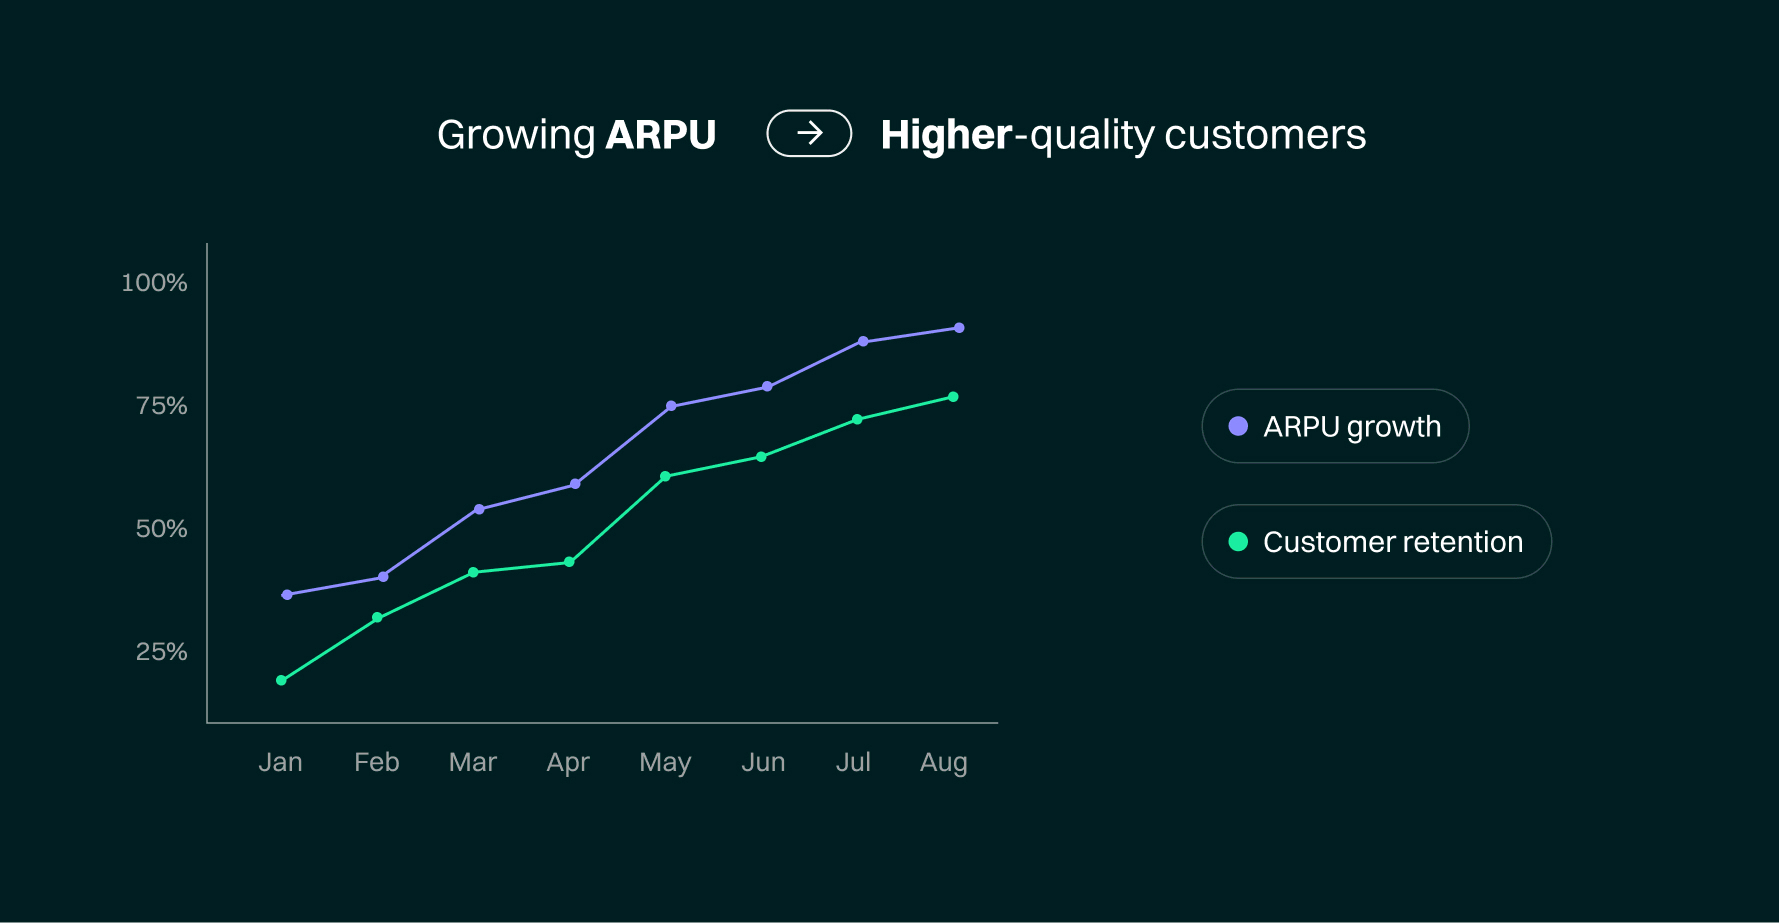
4. ARPU / Average Ticket / Retention
The metrics that reveal long-term organizational health.
ARPU/Average Ticket:
- Shows how much value you extract from each customer.
- An increasing trend = higher quality customers or effective upselling.
Retention:
- The silent growth multiplier.
- Retaining 80% of customers reduces pressure on acquisition
- Improves global profitability.
It is more expensive to acquire a new customer than to keep an existing one.
How to present business metrics to the executive committee
Mastering the right metrics is half the battle. Presenting them in a way that resonates is equally critical.
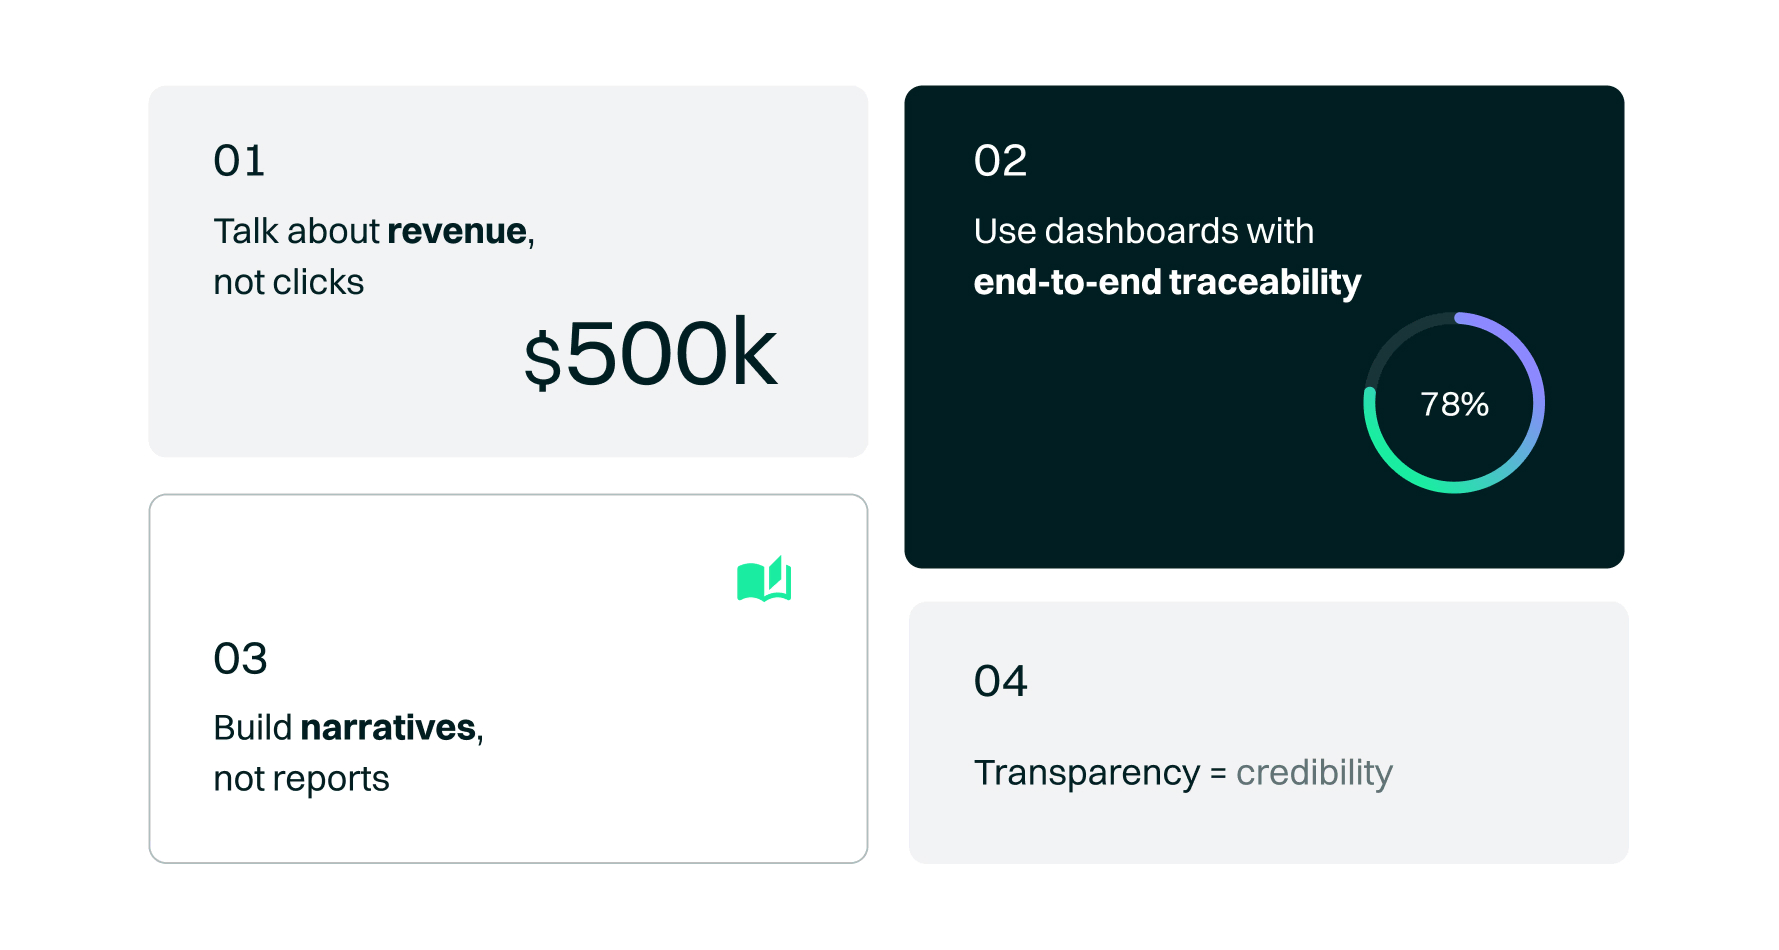
1. Speak in revenue, not clicks
❌ Before: «We generated 50,000 leads this quarter.»
✅ Now: «We acquired 2,500 new customers with a projected value of $500,000 over the next 12 months.»
2. Use dashboards with full traceability
Show the full journey:
Spend → Leads → Opportunities → Customers → Revenue → LTV.
This demonstrates that you understand the business end-to-end.
3. Build narratives, not reports 59
Example of an effective narrative:
«We invested $50,000 in segmented digital campaigns → generated 500 qualified leads → closed 50 customers with a CAC of $1,000 and projected LTV of $4,500 → estimated ROI of 225% over 18 months.»
Numbers inform. Stories persuade.
4. Transparency = Credibility
Present successes and learnings. A CMO who acknowledges which channels didn’t work and how resources are being reallocated builds more trust than one who only shows victories.
Beyond clicks: Building strategic credibility
Traditional marketing metrics remain useful for tactical optimization, but they are not sufficient to justify your place in strategic conversations.
The executive committee wants:
- Revenue
- Profitability
- Sustainability
- Scalable growth
The result: When you demonstrate that every dollar invested generates X dollars in return, that your customers generate increasing value, and that your strategy is scalable, you stop being a cost center and become a growth engine.
The current reality
The pressure is not going to decrease. Budgets will remain tight and expectations high. But leaders who master the art of measuring and communicating real impact will not just survive—they will thrive.
A click doesn’t pay the payroll. A customer does.
Do you want to implement end-to-end measurement that connects every investment with tangible results?
Discover how to measure CAC, LTV, and real conversion with a complete view of the customer journey. We help you detect opportunities by analyzing your entire acquisition process. Contact us here.